The next time you need to make an important decision, try slowing down.
Once a decision is made, the consequences will naturally follow and you can’t eliminate those consequences to go back to the drawing board. There is no time machine you can use to save you from bad outcomes. There are no redos. If the genie is out of the bottle, there is no putting him back in. But you can anticipate what the second-order consequences might be.
To get better at predicting future outcomes utilize a decision tree.
The one question to ask
To start making better decisions today use this question: And then what?
If you have children, you know they have an infinite capacity to ask questions. Their little minds are sponges and they are curious about how stuff works. Children ask simple questions like, “Why do I have to go to school?” And after receiving an appropriate answer, they’ll continue to dig.
“Well, it’s important to learn.”
“Why is it important to learn?”
“So that you have a strong foundation of knowledge.”
“Why is a foundation of knowledge important?”
“. . .”
This can (and will) go on forever if you allow it.
If we apply that kind of unconstrained curiosity to decision making we call that analysis paralysis. But drilling down a few levels by asking “And then what?” will help us map out a more detailed future and consider second-order consequences and beyond.
But asking “And then what?” is not enough.
Is the glass half full or half empty?
We are all hard wired to have a more optimistic or pessimistic worldview.
That’s important to note because it impacts our ability to make decisions. Leaders that tend to see only the “bright side” of things fail to see challenges that could have been avoided. They are blindsided by poor outcomes they could never imagine happening. On the other hand, pessimists may fail to act or take calculated risks because fear of failure holds them back.
The other problem with our optimistic or pessimistic hard wiring is that we only see one side of the coin.
Just because you focus on heads, doesn’t mean tails do not exist. If you flip a coin enough, the outcome should be 50/50 heads or tails. Just like the coin, we are guaranteed to experience both positive and negative outcomes even if we ignore one half of that reality.
So how do you override your natural disposition in order to have a full picture of what might occur?
The importance of planting (decision) trees
A decision tree is a tool to thoroughly map out a decision you need to make.
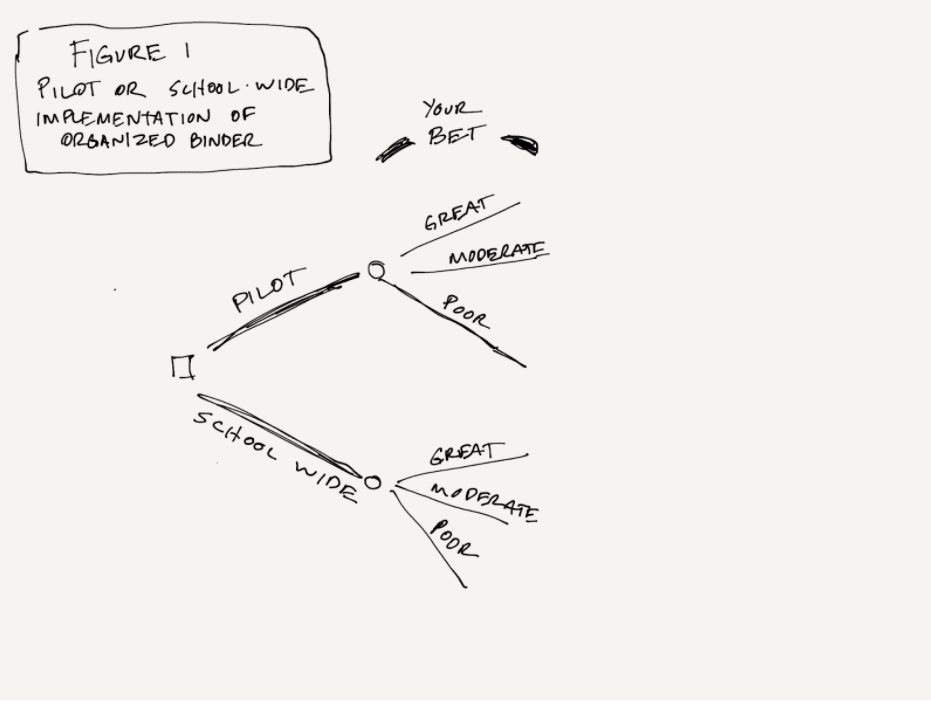
Start with a decision you need to make and draw a small square on the left hand side of your paper. From there draw lines to the right as you consider a robust set of options. With each possible outcome use a circle to depict uncertainty. For each potential outcome, write lines that note each possible outcome.
Consider the example below in Figure 1 where a school principal is looking at Organized Binder as a way to address “learning loss” for students after the pandemic. So would it be smarter to roll out Organized Binder as a pilot or school-wide?

Should I play the NY lottery?
To determine the answer we must understand expected value — the value of an outcome multiplied by the chances it will actually happen.
Your chances of winning the NY lottery is 1 in 45,057,474.00 or a 0.00000002 chance. If you do match all six numbers on two lines you can win two million dollars. So spending one dollar for a chance at two million is a great bet. Wrong.
2 million x 0.00000002 = 0.04.
In other words, that $1 lottery ticket is only worth four cents. It’s a waste of money.
Expected value in our school-based decision
So is it better to pilot Organized Binder or implement it school-wide?
School-wide would reach the most students, but will it have the most potential impact? If we utilize expected value in our decision tree, we can determine the best path forward.
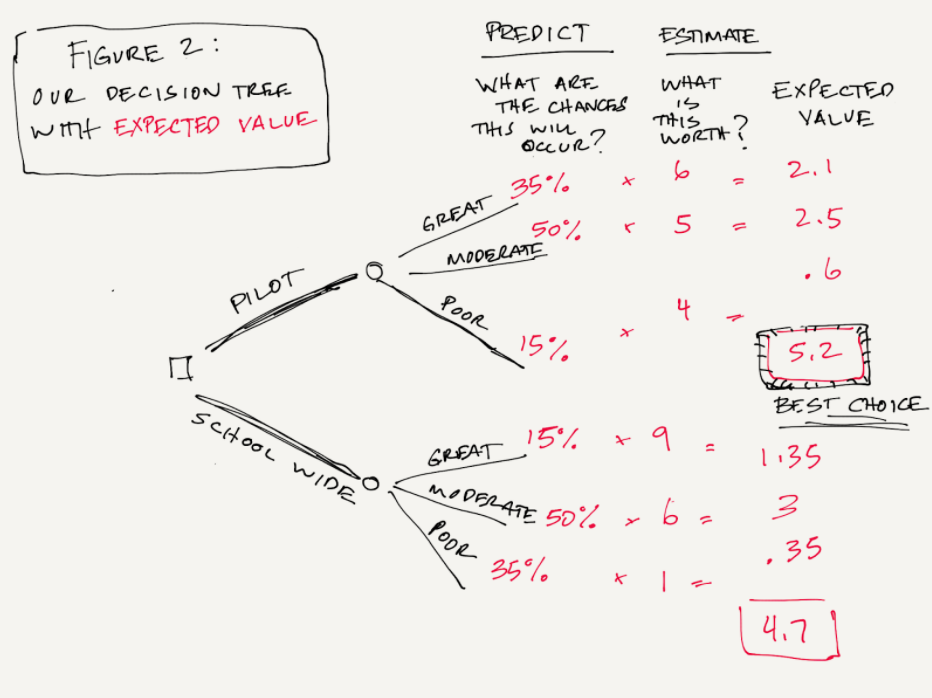
Figure 2 adds a new element to our decision tree. We added the probability of each outcome in terms of great, moderate, and poor reaction to implementation. This must equal 100%.
For the pilot scenario, I estimated a 35% chance of a great outcome, 50% for a moderate one, and 15% for poor. Since there are fewer teachers and students involved I am more confident in the most positive outcome.
For the school-wide scenario, I estimated only a 15% chance at a great outcome, 50% for moderate, and 35% for poor. Since there are more teachers and students involved, I am less confident in the most positive outcome.
Next, we estimated the value a great, moderate, or poor implementation had on student and staff performance. I decided to use a 1-10 point scale. 1 equals the lowest value and 10 represents the best value for our school.
Note: For the pilot scenario, I chose lower value numbers in terms of outcomes because the fewest amount of staff and students receive the benefit of the program. Vice versa for the school-wide model because more staff and students were involved.

In this example, the expected value of a pilot (5.2) is slightly greater than the expected value of a school-wide model (4.7), so the smarter bet is to pilot Organized Binder first.
Did this decision surprise you?


